Opinion
Real-world insights into the sectors we work with.
With our exposure to so many sectors around the globe we have a deep understanding of what the current opportunities and challenges are.
Here, you can find sales-i's latest opinions, thoughts and analysis around the manufacturing, wholesale and distribution sectors globally, with economic impacts that converts businesses to a technological change – and why.
From thought leadership pieces, to coverage on disruptions within specific industries, below read our honest opinions of business environments.
Filter by:

In the realm of B2B sales, it is essential to grasp the complexities of human behavior and communication approaches in ...

In the dynamic world of B2B sales, understanding your clients and effectively navigating their needs is paramount. One ...

In the world of B2B sales, understanding the intricacies of human behavior and communication styles is essential for ...

In the world of B2B sales, understanding your clients' personalities and communication styles is key to building strong ...

Customer needs and behaviors evolve all the time, therefore, sales behaviors and techniques can’t be static - and must ...

What is Artificial Intelligence (AI) in sales?

Taking a customer-focused approach will help to turnaround sales.

When the economy slows down, businesses need to adapt from the ‘business-as-usual’ model and try something different.

Today's distributors and manufacturers have masses of data in their ERP, CRM, accounting, or other back-office systems ...

Any successful sales rep will tell you, the key to overcoming objections is to be prepared. Knowing the most common ...

The sales rep's job is to sell, but there are different approaches to product sales, including value selling. The value ...

Throughout the pandemic, businesses across the board have been doubling down their efforts to get closer to customers ...

With Covid restrictions remaining a fact of commercial life for the foreseeable future, the pressure remains on ...

Being able to pull off an effective video sales call is now a necessity, but it’s not always easy. From technical ...

With the 29th March deadline looming, Brexit is a very real challenge facing every UK industry. The automotive ...

When you’re looking for ways to grow your business, you could do worse than using tried and tested up-selling or ...

Customer Relationship Management (CRM) software has come on leaps and bounds since the digital Rolodex days and is ...

A Relationship Map is designed to uncover connections between customers and prospects. This can be invaluable when ...

Supply chains can set your business apart from the rest. But why not go further and add customer relationship ...

How to perfect the art of insight selling for your business. Customers don’t want to be coerced into making a purchase ...

A simple look at Software as a Service, Platform as a Service and Infrastructure as a Service. What are they and how do ...

“Acquiring a new customer is anywhere from 5 to 25 times more expensive than retaining an existing one.”
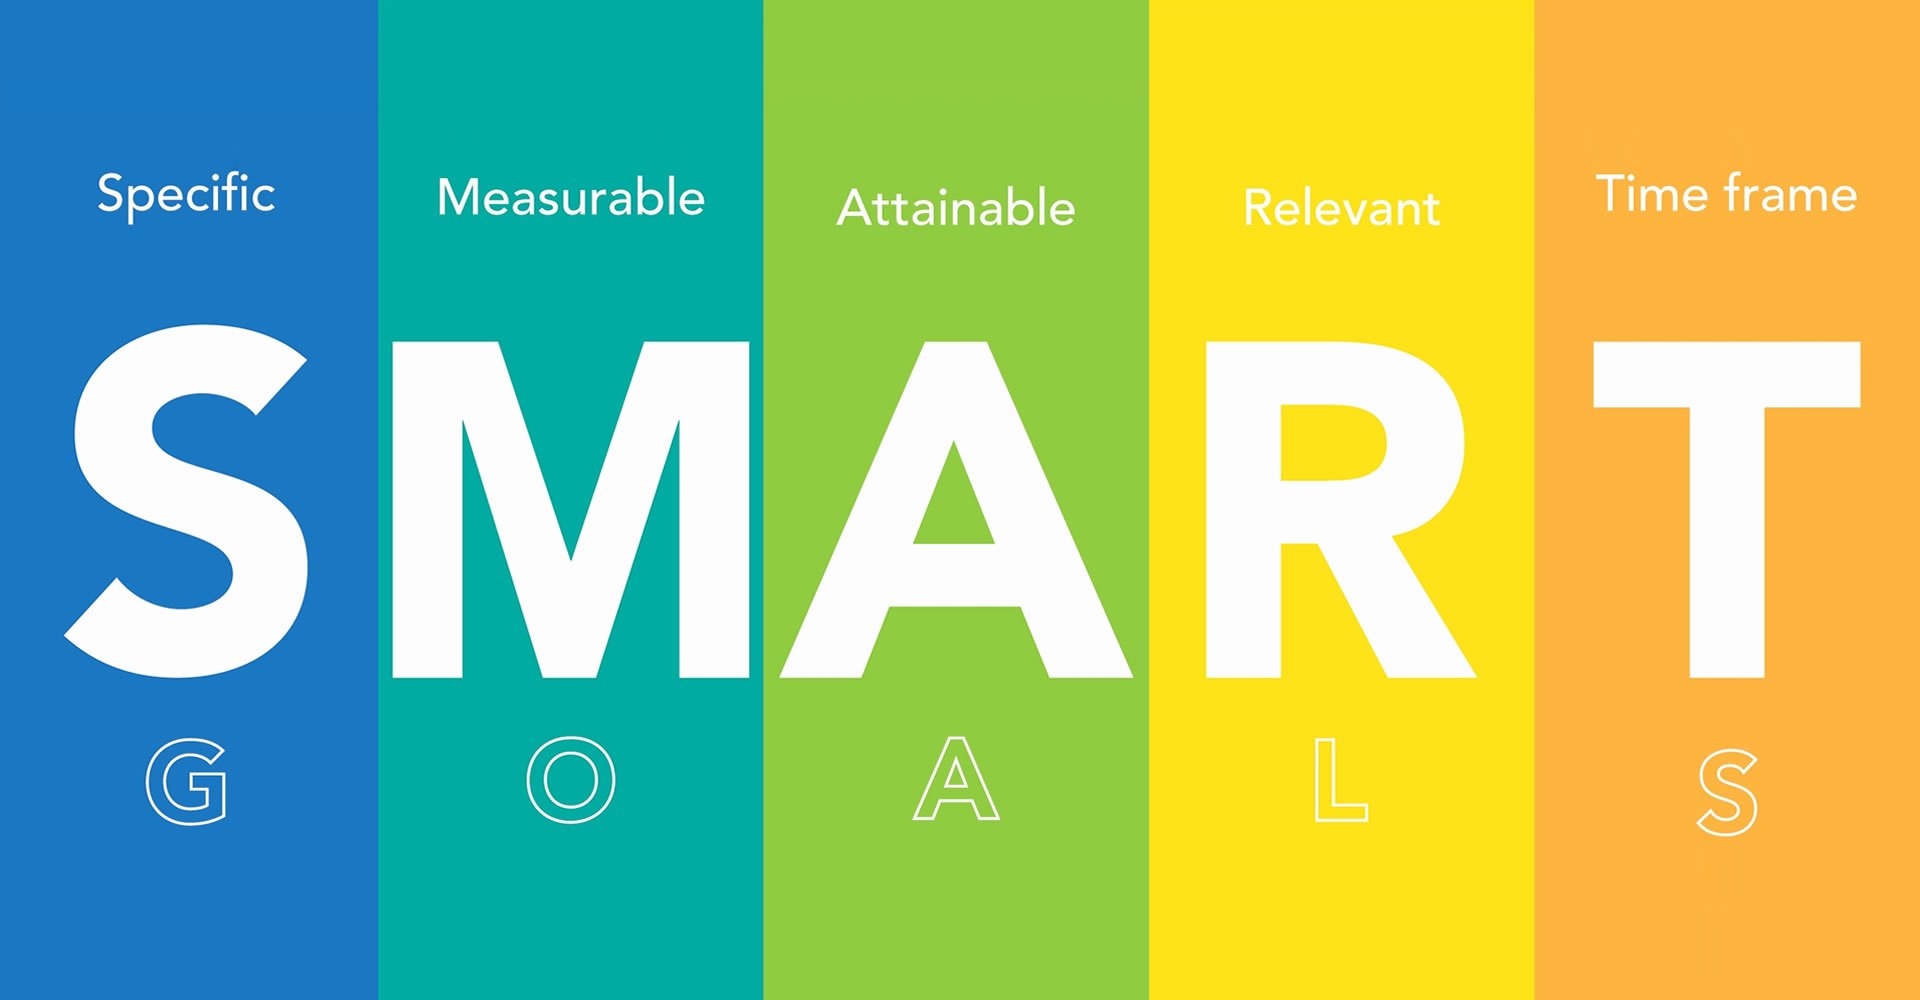
What makes an effective sales goal and how can you make sure that yours will motivate your salesforce to reach their ...

Have you considered SaaS software as a solution for your business? In the battle of SaaS vs on-premise, which wins? ...

Monitor your sales performance using key performance indicators (KPIs). Read on to see examples, how to set them and ...

When you’re trying to grow your business, bringing in new customers or clients left right and centre seems like an ...

Business Intelligence has probably been around a lot longer than you could possibly imagine. But what exactly are its ...

Driving sales performance and developing your business are always going to be at the forefront of your mind. Actively ...

Customer insight is the understanding of your customer, based on their buying behavior, their experiences with you, ...
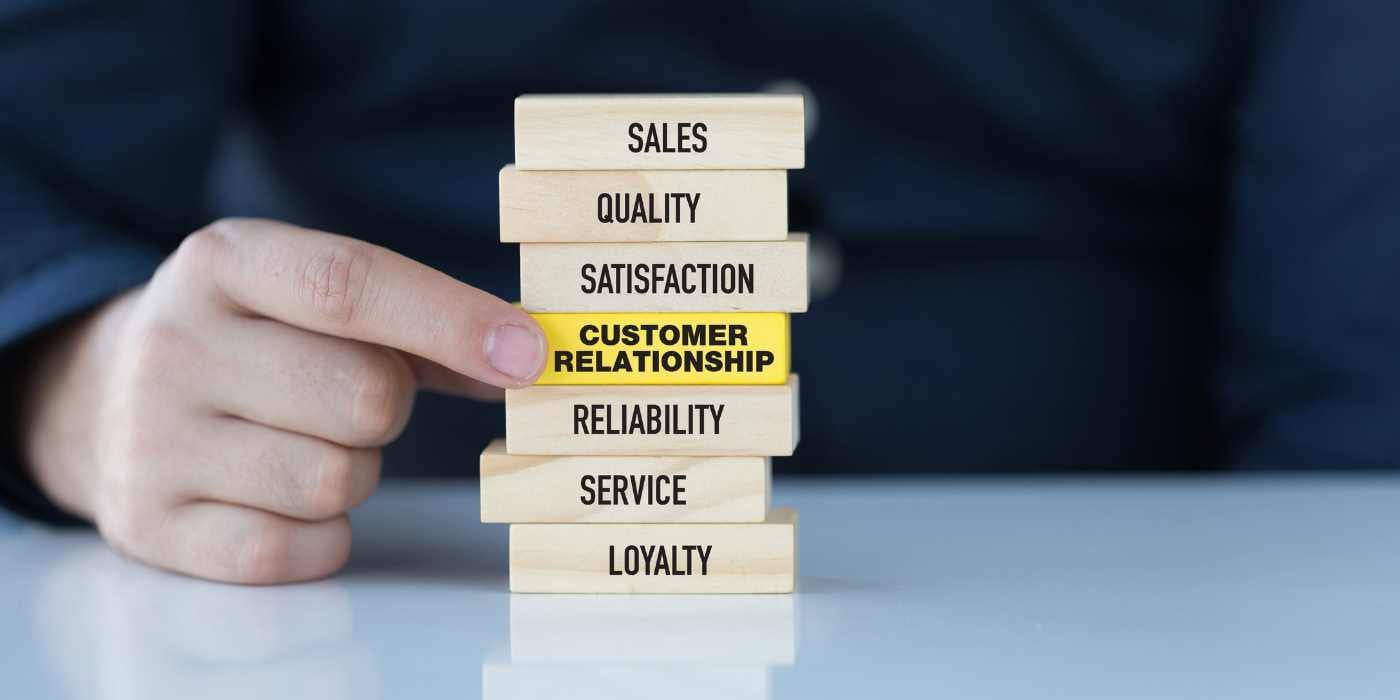
Businesses often deprioritise maintaining good customer relationships with existing contacts in search of new ones.

The term contact management software used to be synonymous with an online address book. Sure, it could be shared across ...

Regardless of what you may have heard elsewhere, size doesn’t matter – when it comes to implementing CRM software that ...

Here are 99 sales stats that will make you sell smarter:

What is Predictive Analytics? Predictive analytics uses statistical algorithms and machine learning techniques to ...

Did you know you can refine, streamline and improve every area of your business, too, through the use of data? To know ...

Sales intelligence software (SI) is designed to make a salesperson’s job easier. It looks at your sales data and does ...

When it comes to using a CRM system, Cloud-based CRM solutions have introduced a completely new way of doing things. ...

Are you getting nowhere from gatekeepers and prospects that ignore your calls?

What makes some inside sales reps successful, while others fall behind? We look at some of the most common traits that ...

According to The Guardian, the number of new-build homes in England is at a record high since the economic downturn in ...

The sales-i guide to writing a sales pitch A good sales pitch is the difference between a customer running for the ...

The building supplies industry is one of the most difficult to compete in. Here are four tips to help you to get ahead ...

Right now is the perfect time to be working in sales. There are challenges (thanks to the past two years), and there ...

We talk a lot about Business Intelligence here on our blog but sometimes I wonder if everyone reading it really knows ...

Most bits of new technology these days simply don’t come with a fully loaded instruction manual like the technology of ...

As a relatively easy way for companies to stay on top of their game and keep customers on side, the countless benefits ...

Converting prospects into paying customers is always a testing point in the sales process. If you embrace the skills ...

Every company I’ve worked for has always had a sales team putting pressure on Marketing to provide ‘leads’, which is ...

We all know that familiar saying, “you need the right tools for the job”, and in the business world, this is no ...

It’s true, there is a certain art to being a great salesperson. While there are certain personality traits and ...