<img alt="" src="https://secure.insightful-enterprise-intelligence.com/784173.png" style="display:none;">
Request a free demo Log in search-icon

Feature Spotlight: Simplified Sales Reporting

Reporting that doesn't require a PhD in Math to understand

We get it. We're Salespeople too.

Sales people are busy. They need information. No, scrub that. They need insights. And they need them yesterday.

So who has time to sift through lengthy customer or product reports.

sales-i reports are different. See for yourself.

It's the report we get asked about the most...

Every salesperson wants to know which of their customers has stopped buying. ERP's are not geared up to satisfy this simple request. But sales-i can!

Not only can you access this data in less than five clicks, but you can even automate it so that if one of your top customers stops spending, we will alert you.

Down on Spend


2 Clicks. 15 Variables. Maximum Insight.

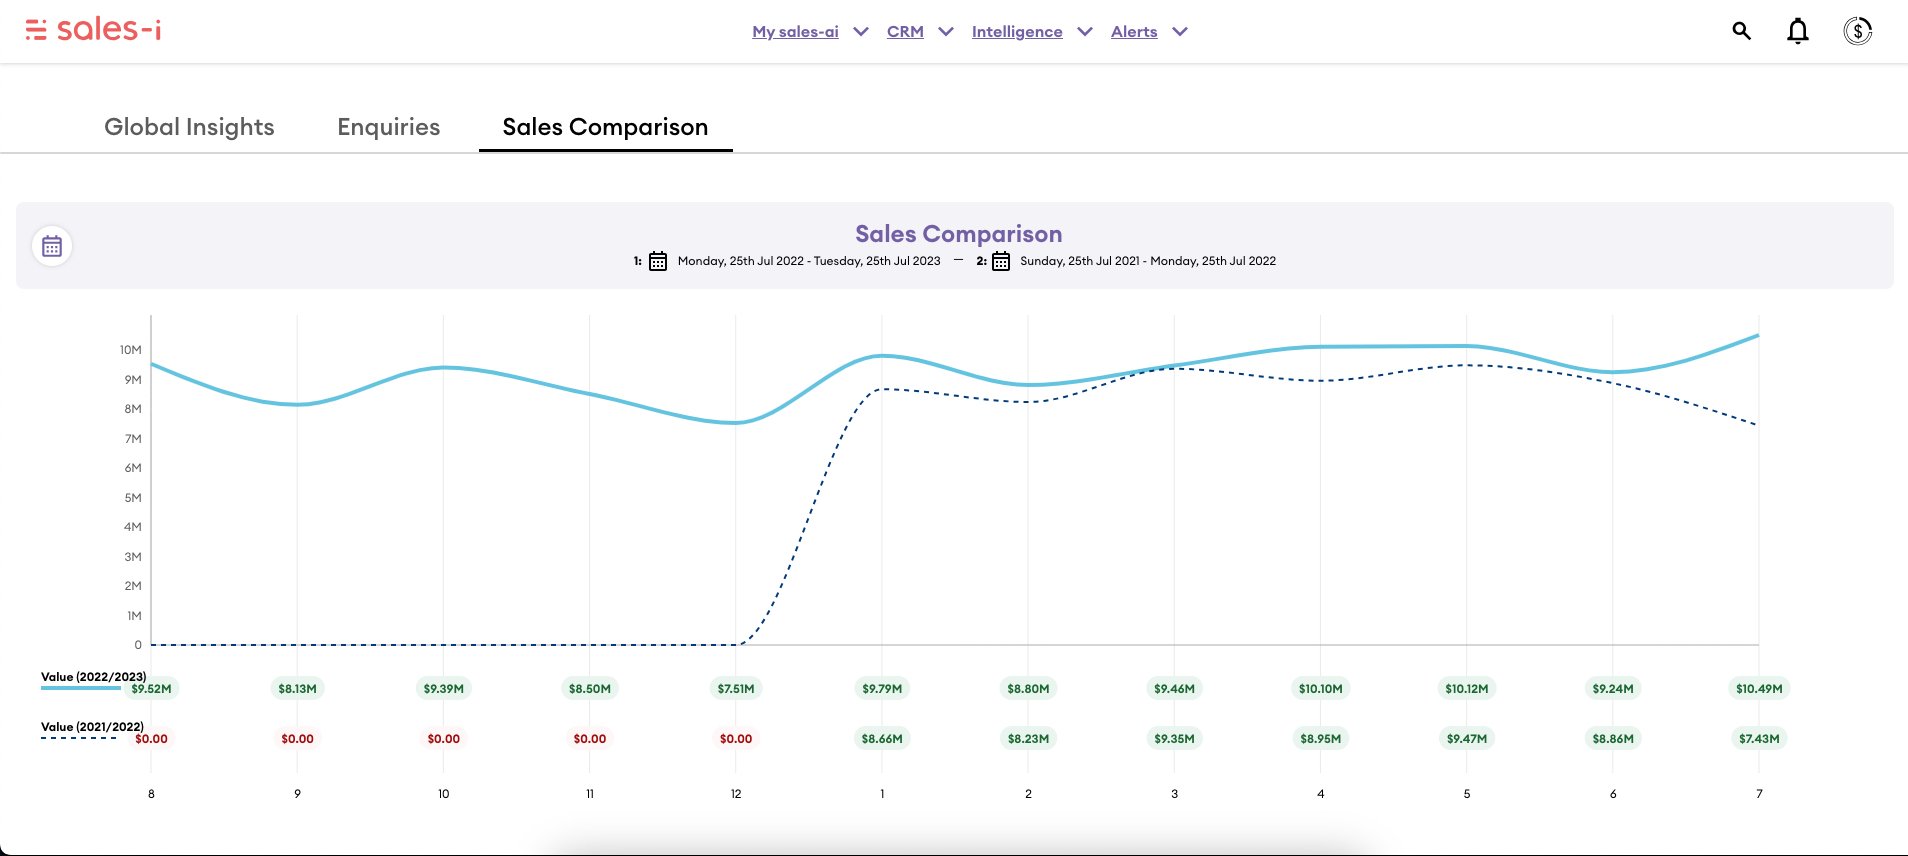
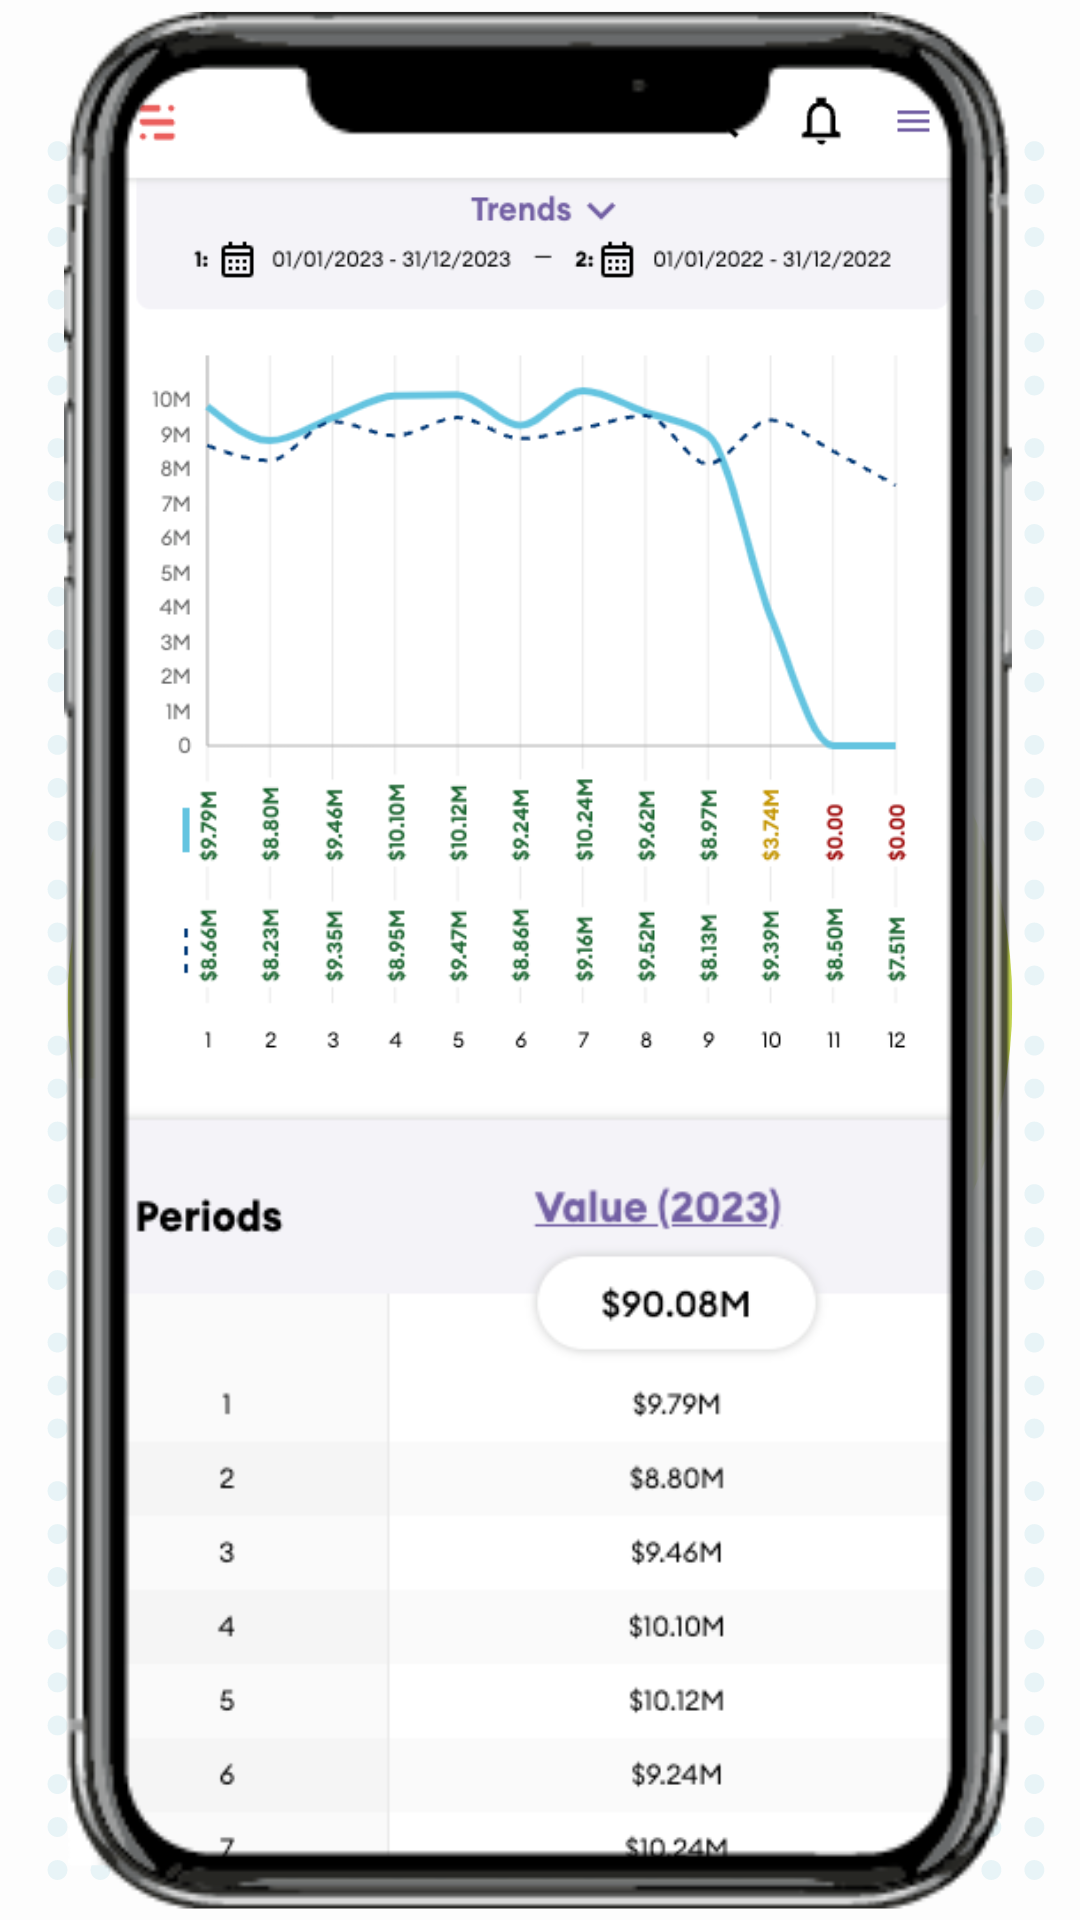
Sales comparison provides you with a brief performance overview of your sales organization. It plots a year-on-year comparison of the sales value achieved each month/period. 

Sales Comparison


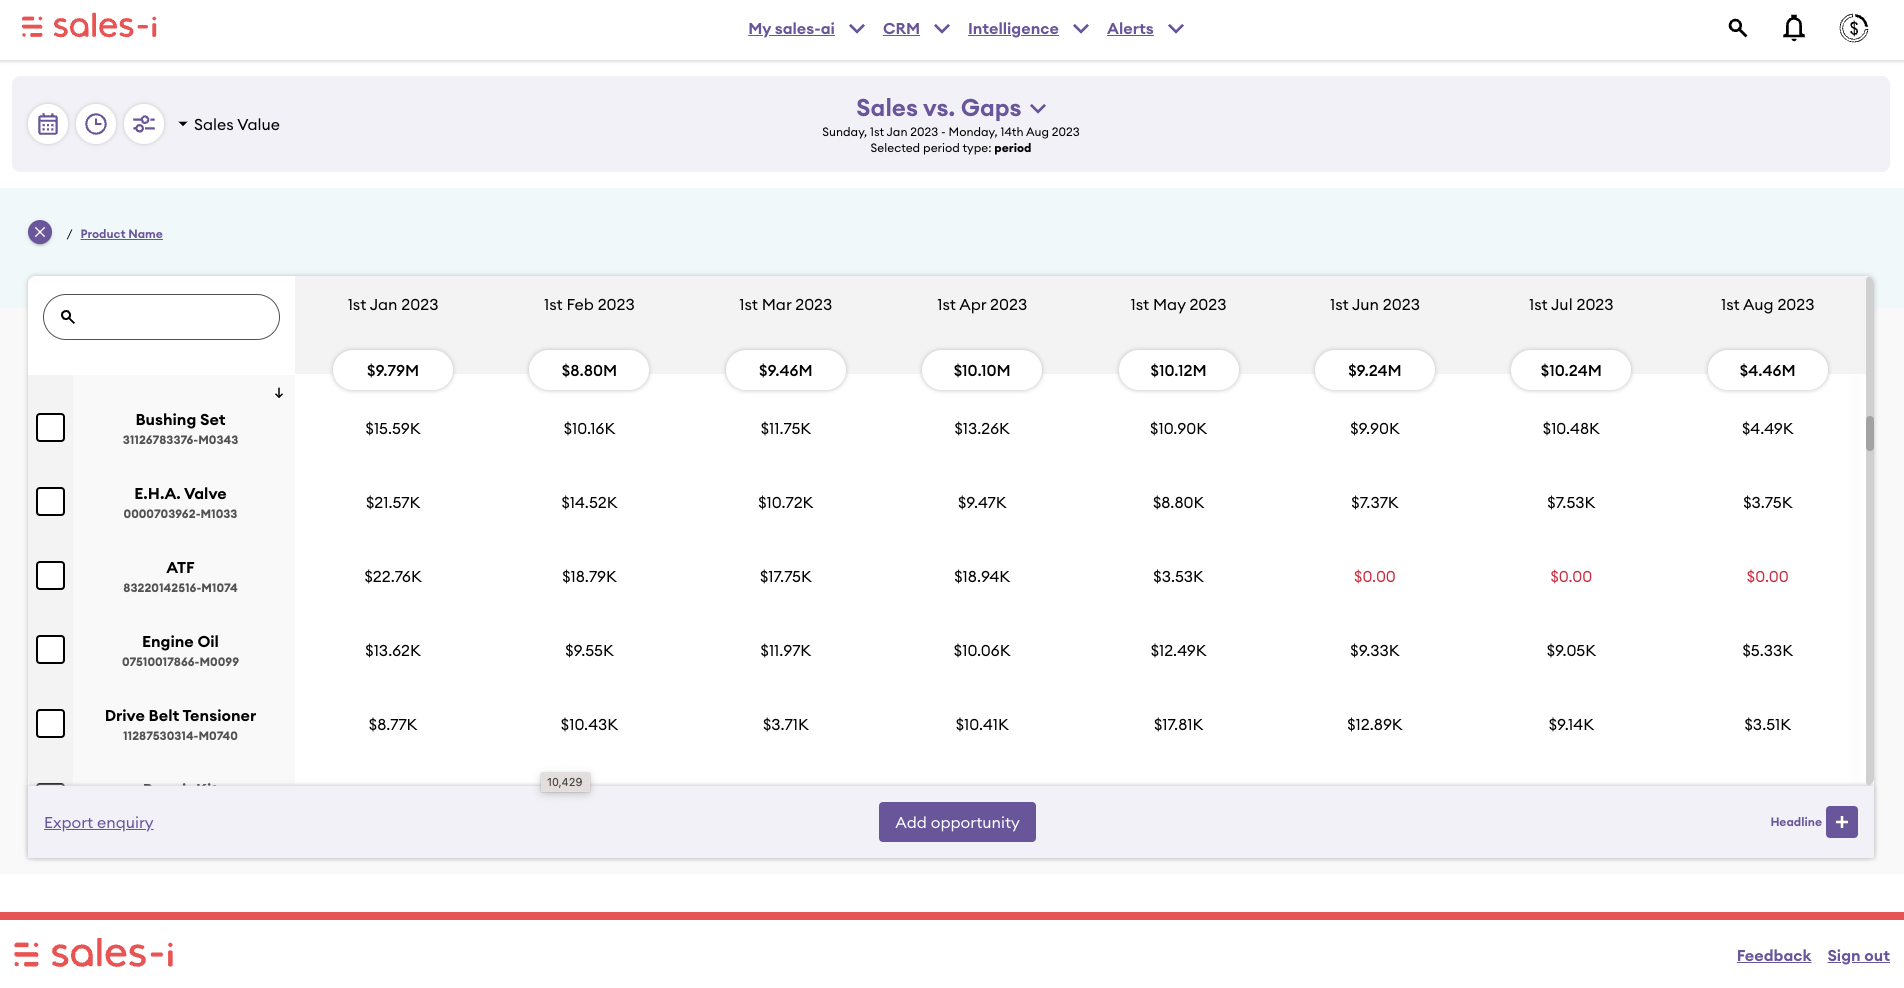
Sales vs. Gaps report enables you to understand customer buying patterns over a selected period and ultimately see where some customers have stopped spending so you can take action to remedy the situation. 

Sales vs Gaps report


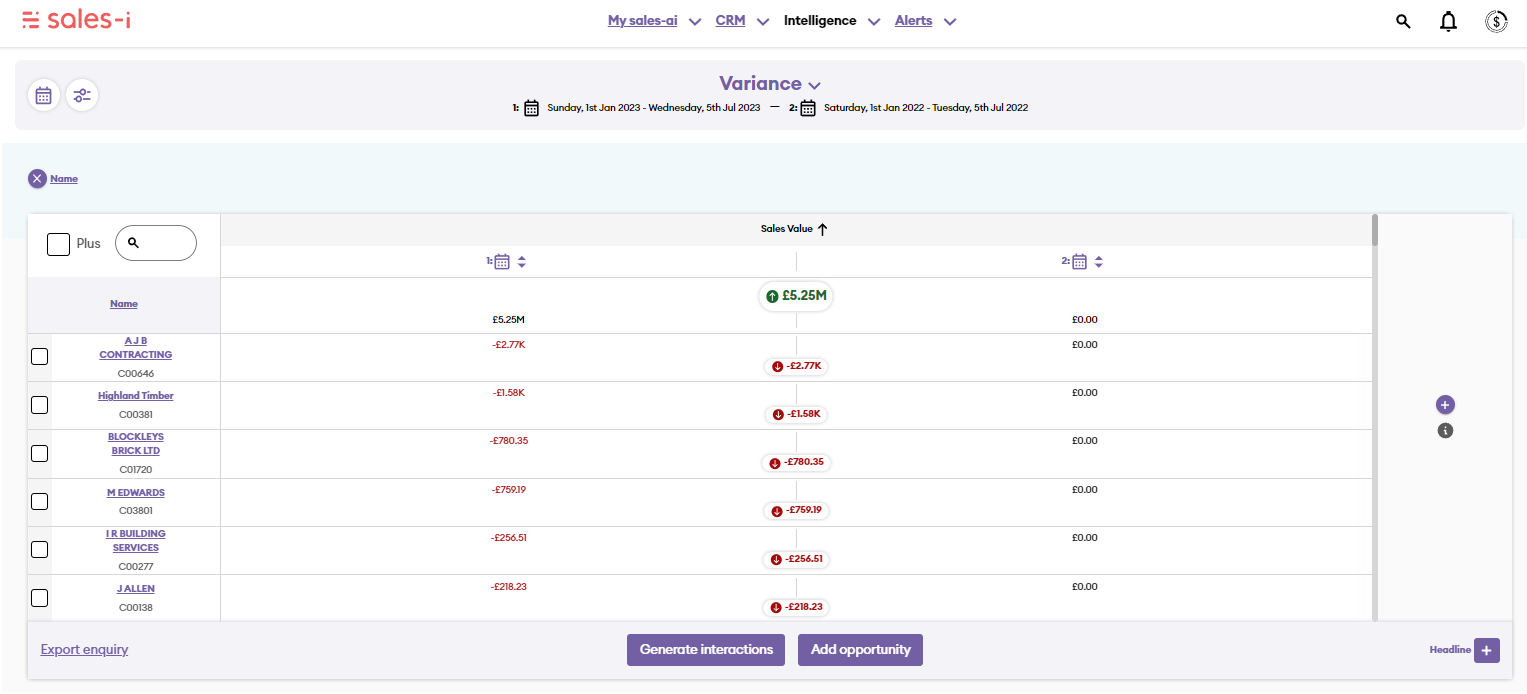
The Variance report is perfect if you're trying to understand whether you are up or down based on key metrics. Just run the report and plot two periods of time against each other so that you can see the degree of variance between the two time periods.

Variance Report Ai


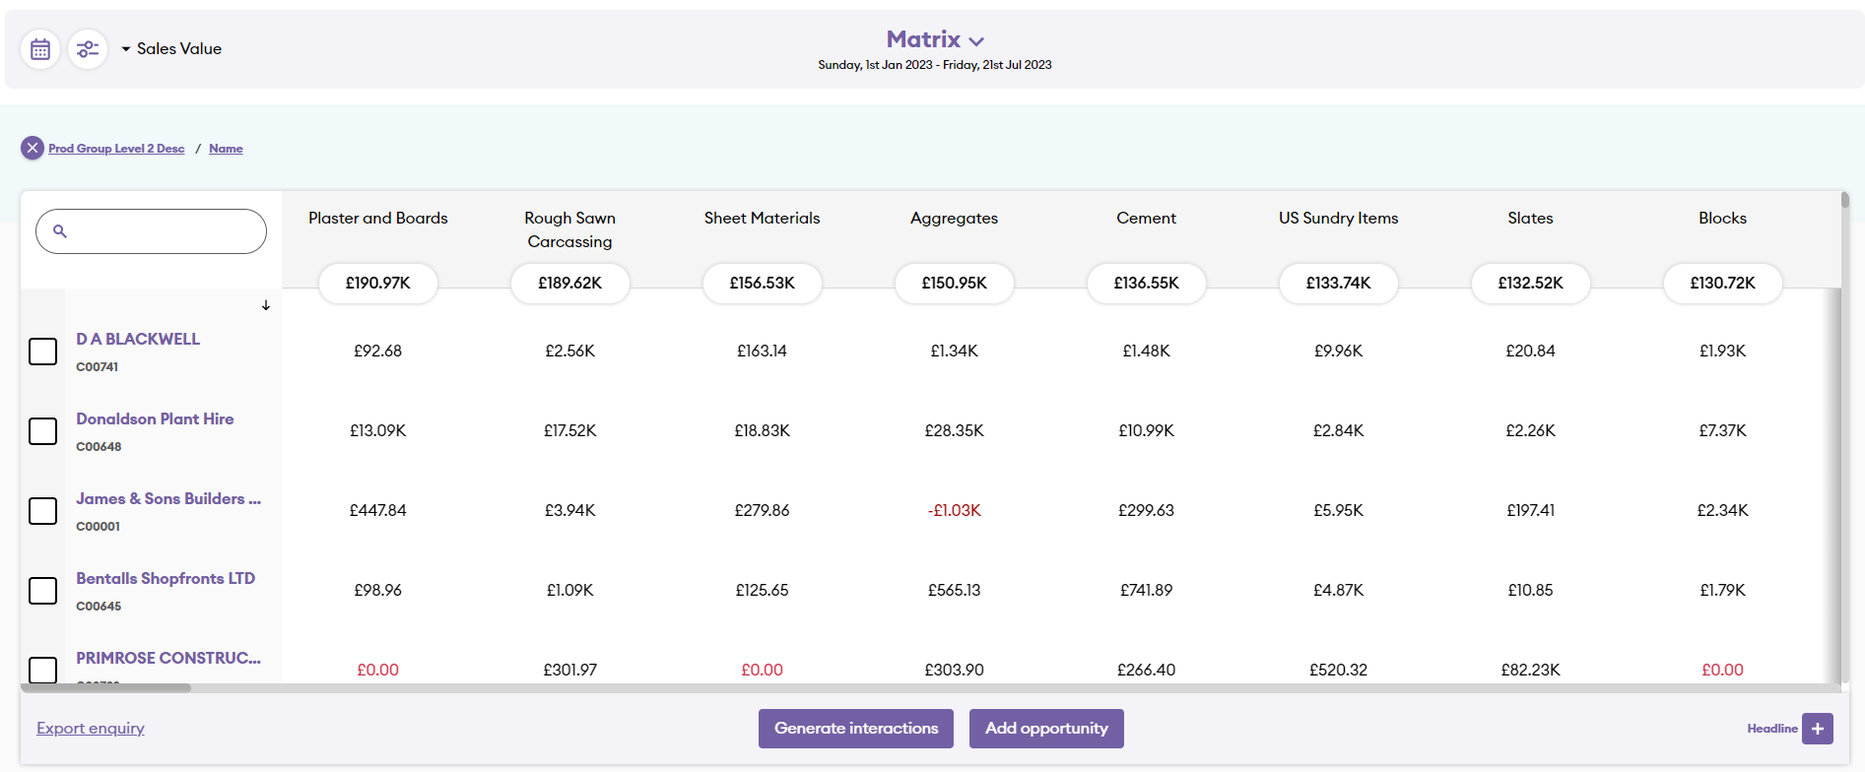
The Matrix report lets you understand the relationship between two data dimensions. For example, you can plot a list of customers and see what level they buy certain products to analyze customer behavior and its impact on product sales 

Matrix

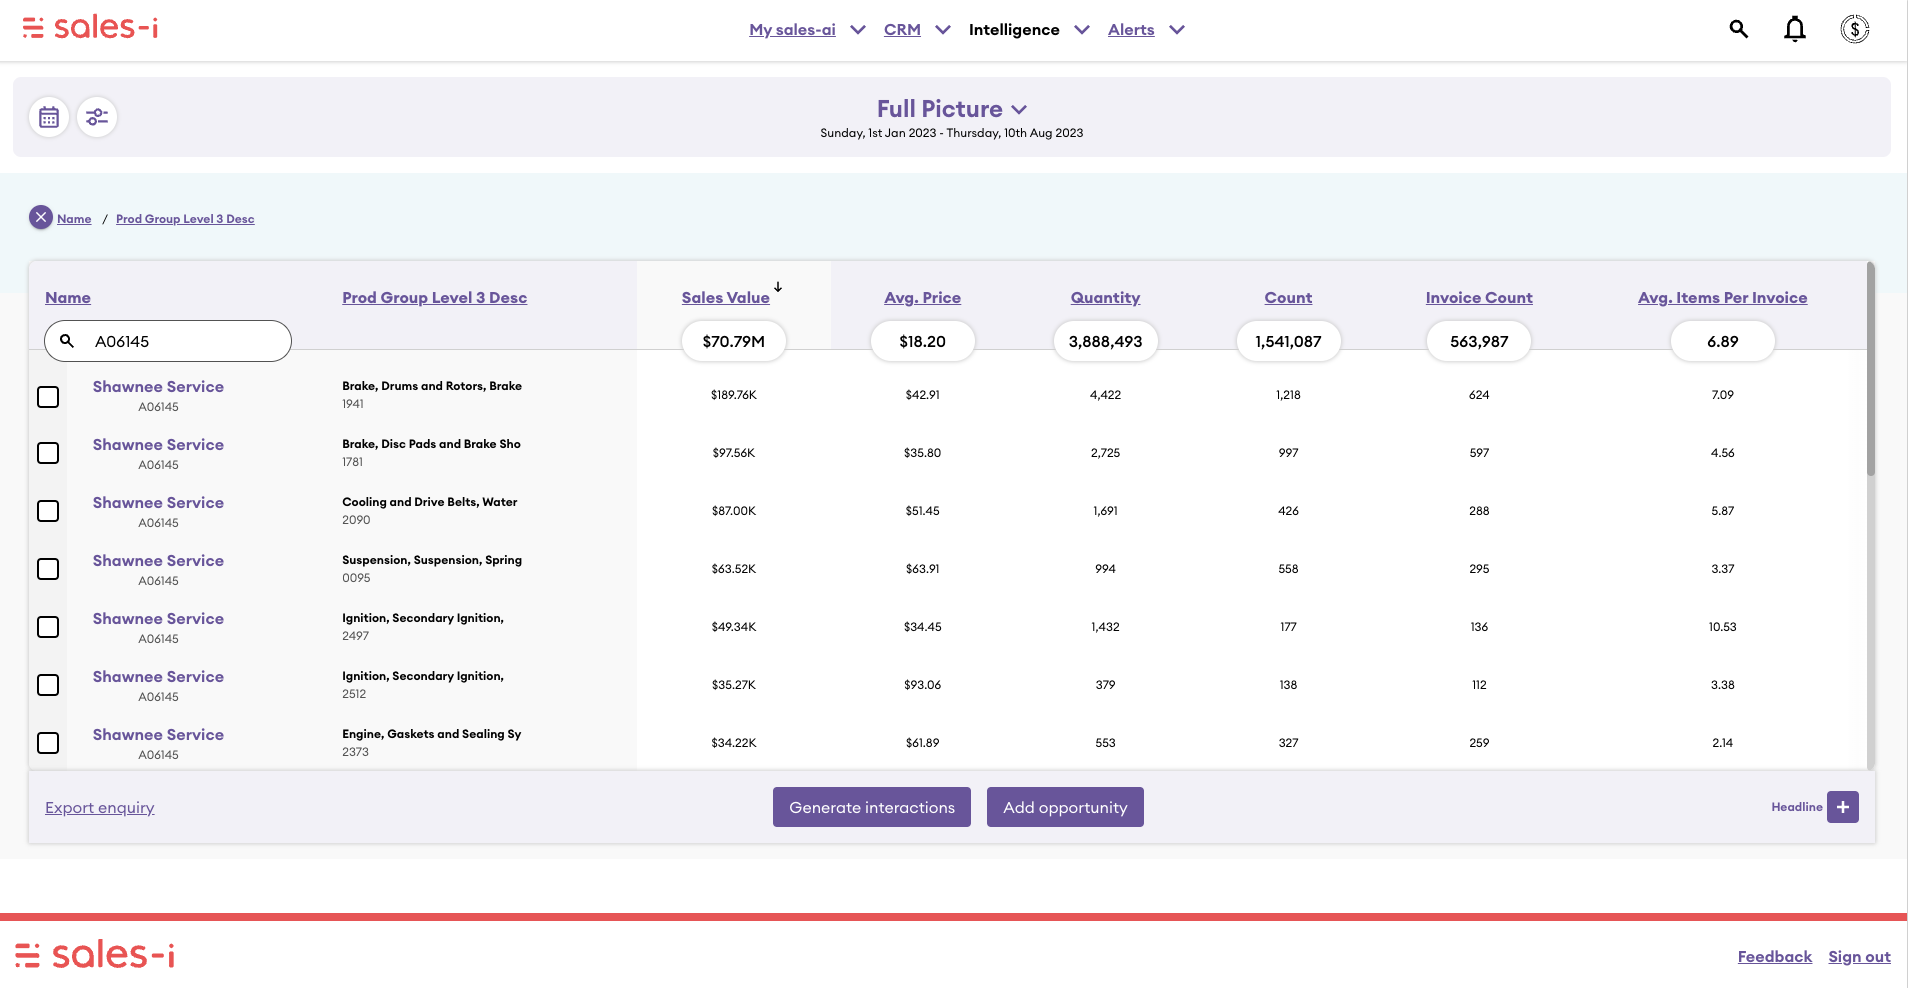
Full Picture allows you to look at how KPIs are performing for a specific date range. KPIs that you can cut the data by are:

  • Sales value
  • Cost
  • Profit
  • Gross Profit
  • Average Price
  • Quantity
  • Count
  • Invoice Count
  • Average Items per Invoice 

Full Picture


Ai Mock Up - Reporting - Mobile

Benefits of Simplified Reporting

Time Saving

Simplified reporting streamlines the process of generating sales reports, reducing the time and effort required to compile and analyze data.

This allows sales teams to focus more on actual selling activities and building customer relationships.

Timely Decisions

With data presented in a clear and straightforward manner, sales managers and executives can quickly grasp the key insights and make informed decisions to optimize sales strategies and tactics.

This allows businesses to be far more responsive to a volatile market.

Enhanced Visibility

Easy-to-understand reports provide greater visibility into sales performance, trends, and opportunities.

This transparency can help identify potential issues early on, such as declining sales in a specific region or product, enabling proactive measures to be taken.

Improved Forecasting

Accurate and concise reporting allows for more reliable sales forecasting. This, in turn, enables businesses to set realistic goals and allocate resources appropriately.

Inaccurate sales forecasts can be banished forever.

FAQs

Can I export gap reports in pdf format?

Absolutely! Just click the Export button and choose PDF as the output format.

Can I build/export reports on the mobile app?

Sure thing! With sales-i reports, you can effortlessly drill into your data on both the desktop and the mobile app. To export on the mobile app, click the three lines, choose Export, select PDF, and click Export

Can I compare the previous year's sales?

Yes, you can! Using our Variance report, all you need to do is to select the date range and view the comparison instantly. 

Can my reps understand variance reports easily?

sales-i reports are designed with simplicity in mind, so your team can easily and quickly grasp the insights provided. 

Can I report by customer, product and/or sales data?

Yes, you can tailor your report to focus on the specific insights. Our reporting feature is highly-customizable, so you can report by customer, product, or any specific sales data point.

Is any training required to read the insights?

No training is required! sales-i uses easy-to-understand charts to ensure you can read and understand insights effortlessly. 

How frequently should I create full picture reports?

For an in-depth view, we recommend creating full picture reports daily to stay informed and make better decisions.

Looking for something else?
Related Content
4 reasons your reporting needs data visualization
What is Data Visualization? Data. If you have a lot of it – and who doesn’t these days – it can be overwhelming. While ...
Spreadsheets for business – will we ever learn?
The big question is – why are we still relying on spreadsheets so heavily and is this the alarming wake-up call we all...
Infographic: The power of Data Visualization
Check out our Infographic on how you can harness the power of data visualization in your business to make the most of every...
Ready to See More?

Contact us

Close